Why Prediction Markets Are Bidding Up NVIDIA H200 Compute Prices Through 2026
- David Rogers
- Technology Prediction Markets
- 2026-08-19
NEED TO KNOW
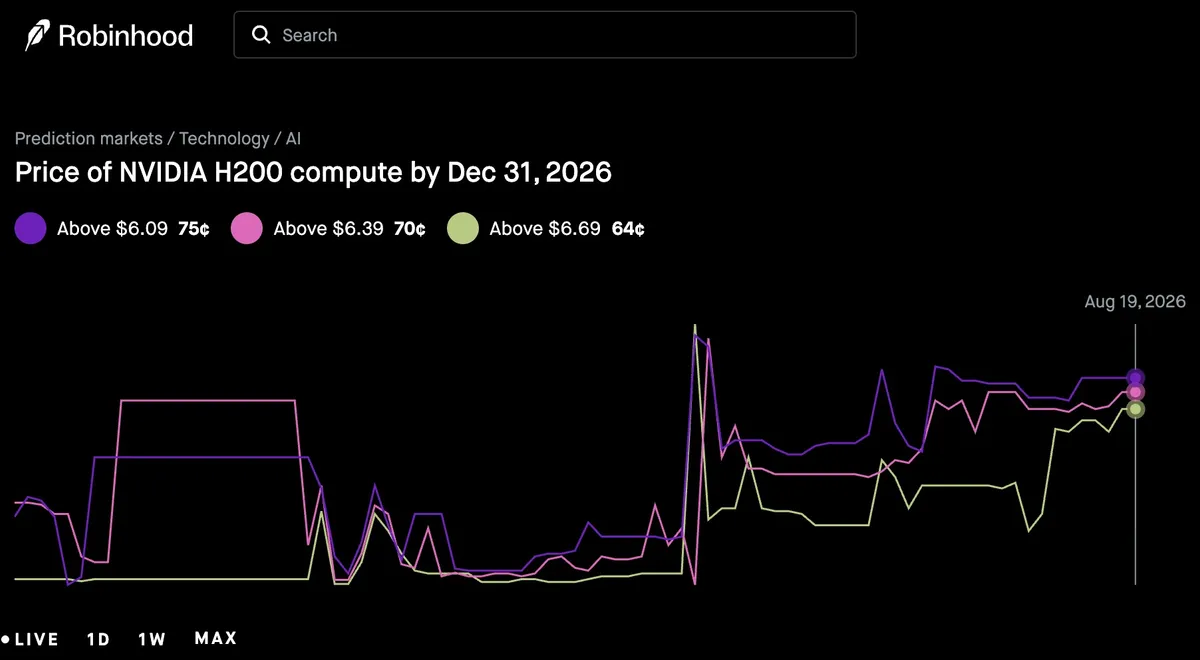
- Prediction Market Disconnect: Robinhood contracts price a 79% likelihood that NVIDIA H200 compute rates exceed $5.79/hr before December 31, 2026, despite spot rates softening from $5.11/hr in mid-August to $4.51/hr on September 1.
- The "Middle-Generation Squeeze": Empirical data from Ornn Data's September 2026 whitepaper reveals that H200 is the least cost-efficient GPU for sparse MoE models (
gpt-oss-120bcompute cost is $0.98/M tokens on H200 vs. $0.29 on A100 and $0.47 on B200). - Steepest Forward Term Decay: Ornn's forward curve marks show H200 suffering the steepest pricing decay of any datacenter family: retaining only 51.0% of its one-month price at 3 years and 43.7% at 5 years (implied forward for years 4–5 drops to 33%).
- Memory Moat vs. Throughput Economics: While 141GB HBM3e provides high bandwidth (4.8 TB/s) for extreme single-device context, throughput-per-dollar economics for open-weight agentic workloads strongly favor either lower-cost A100/H100 or dense B200 clusters.
- Infrastructure Buffers: Regional grid interconnection delays and Rubin platform validation delays prevent immediate fleet retirement, but cannot fully offset Blackwell supply pressure.
- Revised Peak Forecast Band: Recalibrated modeling projects fourth-quarter 2026 peak spot rates between $4.65 and $5.45/hr, suggesting Robinhood contracts above $5.79 are significantly overpriced.
Robinhood prediction markets show strong confidence that NVIDIA H200 compute rental prices will rise before December 31, 2026. Event contracts price the probability of hourly rates exceeding $5.79 at 79%, exceeding $6.09 at 75%, and exceeding $6.39 at 70%. However, empirical data from Ornn Data’s September 2026 market report indicates that the underlying Ornn index tracked H200 spot instances at $4.51 per hour on September 1, 2026 /Ornn/ /Ornn Data/, pulling back from mid-August highs near $5.11. To breach the lower strike of $5.79 before year-end expiration, H200 rates must appreciate by over 28.4%—a steep climb given emerging competitive pressures across the hardware fleet.
| Model Component / Factor | Mechanism & Directional Impact | Model Adjustment ($/hr) |
|---|---|---|
| Current Ornn Baseline Price | Settled spot index benchmark as of September 1, 2026. | $4.51 |
| Model Architecture Shift (MoE & Reasoning) | 141GB HBM3e aids large single-node context, but token-production economics on sparse MoE face severe competition. | +$0.10 to +$0.20 |
| Rubin Platform Delays | HBM4 and CX9 networking validation delays push Rubin deployments to 2027, preventing early decommissioning of Hopper fleets. | +$0.20 to +$0.30 |
| Export Controls & Global Tariffs | Regional trade barriers and licensing curbs restrict global supply rebalancing, creating spot shortages in primary regions. | +$0.15 to +$0.25 |
| Datacenter Power & Grid Limits | Multi-year interconnection queues prevent new high-density rack buildouts, sustaining a premium on live H200 nodes. | +$0.35 to +$0.50 |
| Q4 Seasonal Volatility & Capex Surge | End-of-year enterprise budget flushes, frontier model training pushes, and historical holiday demand spikes. | +$0.25 to +$0.35 |
| Blackwell Market Cannibalization | Blackwell expanding to >70% of high-end shipments exerts competitive price deflation on earlier generation compute. | -$0.60 to -$0.90 |
| Alternative Silicon Substitution (ASICs/LPUs) | In-house hyperscaler accelerators (TPU v6, Trainium 2) and LPUs absorb baseline token inference. | -$0.25 to -$0.40 |
The “Middle-Generation Squeeze” on Sparse Workloads
Hardware specifications initially positioned the H200 architecture as an ideal platform for memory-intensive inference /NVIDIA/. Equipped with 141 GB of high-bandwidth memory (HBM3e) and 4.8 TB/s of bandwidth, the H200 allows large models to fit onto fewer GPUs. However, granular workload benchmarking published by Ornn Data in The Economics of Open-Weight Inference /Ornn Data/ reveals a sharp “middle-generation squeeze.”
When evaluating token-generation cost on sparse mixture-of-experts (MoE) models such as gpt-oss-120b (117B total, 5.1B active parameters), the hardware cost hierarchy reverses completely:
- A100 SXM4 (80GB): $0.29 per million output tokens (at base utilization u = 0.5, h = 0.15)
- B200: $0.47 per million output tokens
- H100 SXM: $0.64 per million output tokens
- H200 SXM: $0.98 per million output tokens
Because sparse MoE architectures execute only a fraction of their parameters per token, memory bandwidth requirements are relaxed relative to parameter footprint. On single-device GPUStack runs, an A100 delivers 2,276 tok/s against H200’s 3,013 tok/s on MLPerf v6.0—a modest 32% performance delta that fails to justify H200’s 350% higher rental price ($4.51 vs $1.00/hr). For high-throughput server production, B200’s massive 8,949 server tok/s makes it far cheaper per token ($0.47) than H200 ($0.98). Consequently, price-sensitive open-weight workloads—such as agentic rollouts and reinforcement learning sandboxes at providers like Modal Labs /Modal Labs/—route around H200 in favor of either cheap A100/H100 instances or ultra-dense B200 clusters.
Empirical Forward Curves Challenge Market Pricing
This economic squeeze is directly reflected in Ornn Data’s forward term-price curves. While older A100 silicon retains 80.2% of its one-month term price at the 5-year tenor, H200 exhibits the steepest forward term decay of any datacenter family:
- 1-Year Term: 80.2% of 1-month price
- 3-Year Term: 51.0% of 1-month price
- 5-Year Term: 43.7% of 1-month price (with implied forward retention for months 37–60 falling to just 33%)
Supply chain dynamics, including TrendForce reports on Rubin platform HBM4 validation delays /Jukan on X/ and electric grid interconnect delays, continue to prevent immediate decommissioning of live H200 nodes. However, operating energy costs represent only 1.6% of H200 spot rent ($0.073/GPU-hr at $0.08/kWh and PUE 1.3), meaning power constraints cannot artificially inflate spot rents against declining marginal token revenue.
Our recalibrated analytical model projects fourth-quarter 2026 peak spot rates settling between $4.65 and $5.45 per hour. While enterprise budget cycles and seasonal holiday demand will create transient upward spikes, sustained price inflation above $5.79 is economically constrained by cheaper alternative hardware and rapid Blackwell cannibalization. This suggests that Robinhood prediction market contracts (pricing a 79% probability for >$5.79 and 70% for >$6.39) reflect an overextended bull consensus that has not yet priced in H200’s spot retreat to $4.51 and its unfavorable MoE token economics.
Disclaimer: All forecasts, probability models, and price target estimates are independent projections for educational and research purposes only. Prediction markets carry financial risk and high volatility. This is not investment or financial advice; participate at your own risk.