NVIDIA H100 SXM Compute Price Prediction and Market Analysis: August 2026
- David Rogers
- Technology Prediction Markets
- 2026-08-18
NEED TO KNOW
- Spot Price Stability & Market Resolution: NVIDIA H100 SXM compute rates consolidated firmly and settled at $2.83 per hour on the Ornn composite index on September 1, 2026 (up 20% from March lows), cleanly resolving the August 31 prediction market above the $2.26 to $2.36 strike levels.
- High Market Confidence Validated: Prediction markets priced an 86% to 96% probability that H100 hourly rental rates would remain above the strike thresholds, which was confirmed as spot volatility compressed and prices strengthened into settlement.
- Empirical Forward Term Retention: Ornn forward curve marks establish strong pricing durability: H100 retains 86.2% of its one-month price at the 1-year tenor ($2.44/hr), 68.2% at 3 years ($1.93/hr), and 59.8% at 5 years ($1.69/hr).
- Workload-Driven Demand: Surging open-weight inference, agentic rollouts, and reinforcement learning workloads preserve high utilization across 80GB Hopper systems, mitigating price erosion.
- Operating Cost Overhead: Energy costs represent only 2.6% of H100 spot rent ($0.073/GPU-hr at $0.08/kWh and PUE 1.3), demonstrating that rental pricing is governed by capital amortization and scarcity rather than utility power bills.
- Infrastructure Bottlenecks: Grid interconnect delays, datacenter power limits, and trade-related hardware tariffs provide strong residual value protection for already-energized H100 clusters.
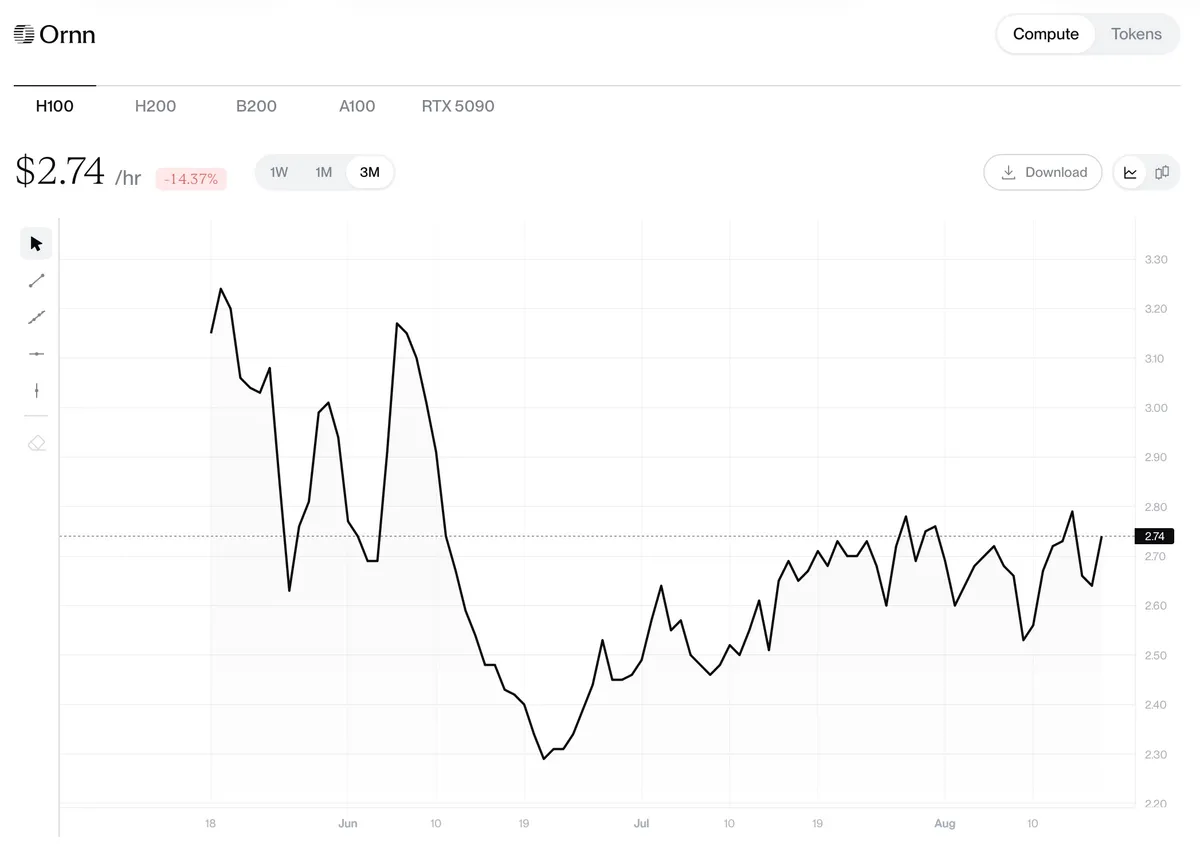
The prediction market accurately priced the August 31, 2026 resolution because NVIDIA H100 SXM compute, built on NVIDIA’s Hopper architecture, traded at $2.74 per hour on the Ornn index in mid-August /Ornn/ and ultimately settled at $2.83 per hour on September 1, 2026 /Ornn Data/, comfortably above the $2.26 to $2.36 strike levels. A decline below $2.36 would have required a 13.9 percent drop over thirteen days; while historical data showed drawdowns were possible during steep drops in late May and mid-June, they occurred in less than nine percent of rolling periods and completely subsided as late-summer volatility compressed.
Step-by-Step Drawdown & Volatility Analysis
Required Drop to Breach Strikes
Empirical Baseline CalculationWith the current Ornn Index clearing at $2.74/hr, breaching the upper prediction market strike of $2.36/hr requires a 13.87% percentage decline over a 13-day window: ((2.74 - 2.36) / 2.74) × 100 = 13.87%.
Empirical 13-Day Drawdowns in 3-Month Dataset
Historical Frequency AssessmentAcross 80 rolling 13-day windows in the 3-month dataset, only 7 windows logged a drawdown of >= 13.87% (8.75% historical frequency), with major drops occurring during May 20–30 (-18.46%) and June 10–22 (-28.75%).
Structural Shift Across Sub-Periods
Market Volatility CompressionMarket dynamics shifted from elevated volatility and cluster liquidations in early summer (May 18 – June 30, max drawdown -28.54%) to tight volatility compression in late summer (July 1 – August 18, max drawdown -7.25%).
The spot price for Hopper GPU compute is fundamentally anchored by sustained workload demand, hardware substitution dynamics, and infrastructure limits. While leading AI labs are shifting focus from massive pre-training runs toward post-training, reinforcement learning, and high-throughput inference serving, H100 systems remain core production workhorses /NVIDIA/. As documented in Ornn Data’s September 2026 whitepaper on open-weight inference economics /Ornn Data/, demand from latency-tolerant workloads—such as reinforcement learning rollouts, coding agents, and batch evaluation—routes efficiently to Hopper fleets. Furthermore, electricity costs represent an unexpectedly small fraction of rental economics: at $0.08/kWh and PUE 1.3, energy consumes just $0.073 per GPU-hour (2.6% of spot rent), meaning spot price behavior is dictated by capital amortization and scarcity rather than operating power overhead.
Next-generation hardware like NVIDIA Blackwell and proprietary cloud accelerators establishes an upper economic ceiling rather than prompting an immediate Hopper crash. Because Blackwell delivers approximately 2.5 to 3 times the training throughput than Hopper silicon, equivalent computing economics set a competitive performance price floor for H100 systems between $2.10 and $2.40 per hour. Broad software ecosystem reliance on CUDA further protects demand for independent cloud providers operating Hopper infrastructure.
Physical power bottlenecks and geopolitical trade barriers also reinforce current rental rates against steep declines. Long electrical utility queues of 24 to 36 months delay new datacenter commissioning, keeping fleet utilization rates for already energized Hopper server racks elevated near 80 to 90 percent and preserving a persistent scarcity premium. Simultaneously, export restrictions and hardware tariffs increase the capital cost of deploying replacement capacity, providing substantial residual value protection for existing domestic fleets.
Event Resolution & Forward Term Outlook
On August 31, 2026, the prediction market expired with event contracts resolving YES at 100¢, as the Ornn spot index climbed to $2.83 per hour. Over longer horizons, Ornn Data’s published term-price curves provide empirical validation of Hopper’s forward depreciation trajectory: H100 term pricing retains 86.2% of its one-month value at the 1-year tenor ($2.44/hr), 68.2% at 3 years ($1.93/hr), and 59.8% at 5 years ($1.69/hr) for contracts extending to 2031 /Ornn Data/. As Blackwell deployments ramp up through late 2026 and 2027, Hopper rental prices will continue settling along this empirical forward curve, serving as the high-volume backbone for distributed agentic inference and mid-tier post-training pipelines.
Disclaimer: All forecasts, probability models, and price target estimates are independent projections for educational and research purposes only. Prediction markets carry financial risk and high volatility. This is not investment or financial advice; participate at your own risk.